ral1sh
56 discussion posts
My main usage of TrayStatus is for at a glance CPU and RAM usage. The latter works perfectly, but the CPU usage often seems to be significantly off from what other common system monitoring tools report, such as Task Manager or Process Explorer. I'm beginning to wonder if it's only reporting on a single core or thread of the system, as I don't think I've ever seen it grow beyond a very small percentage, even when the system is heavily loaded.
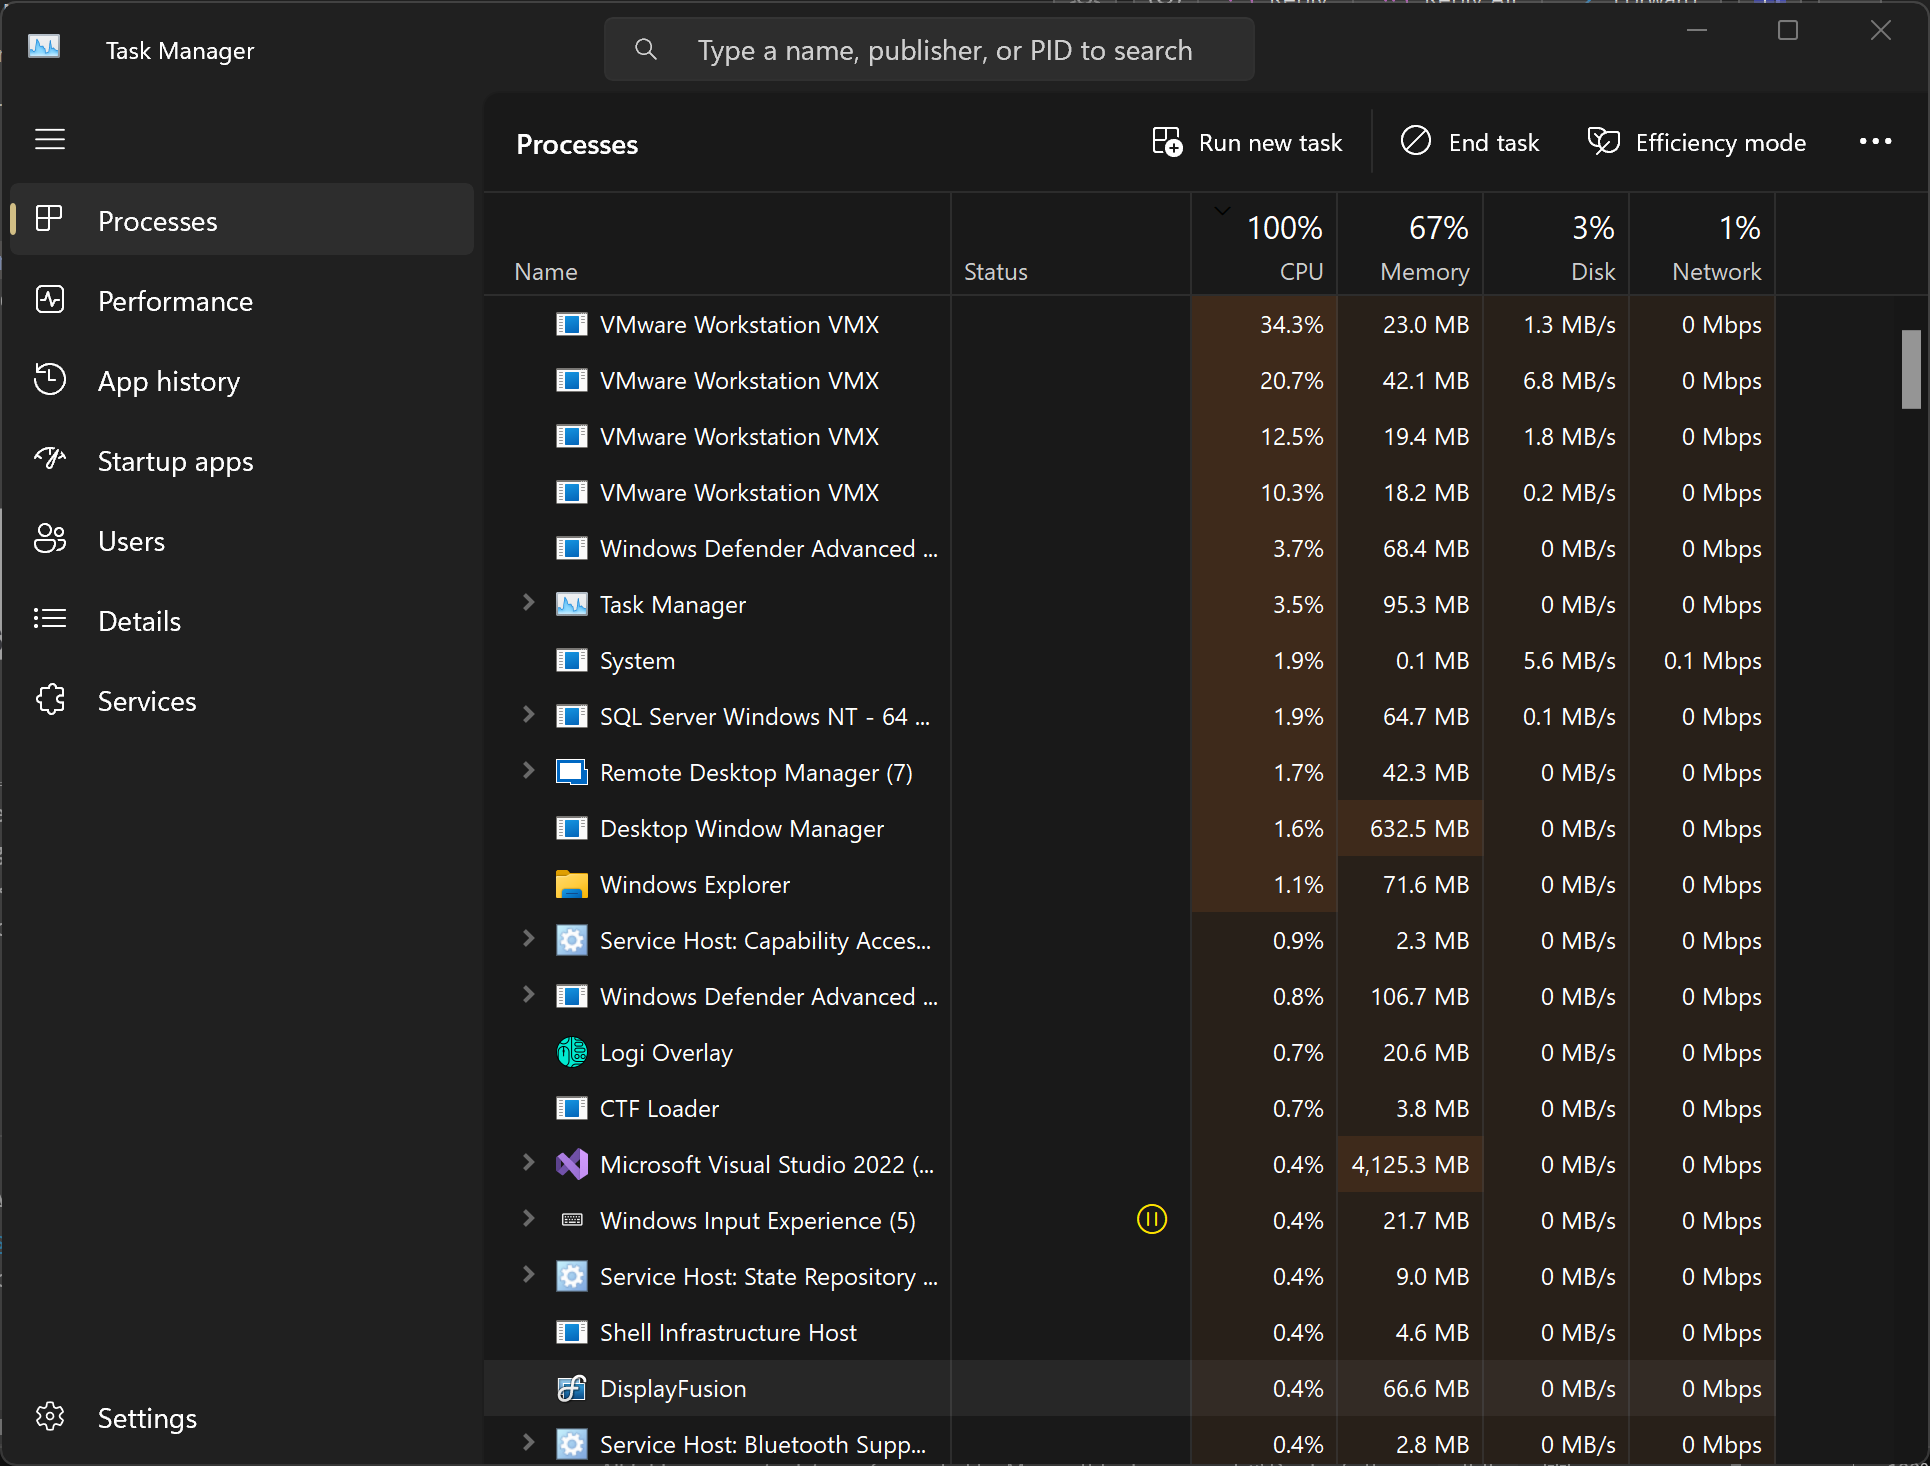
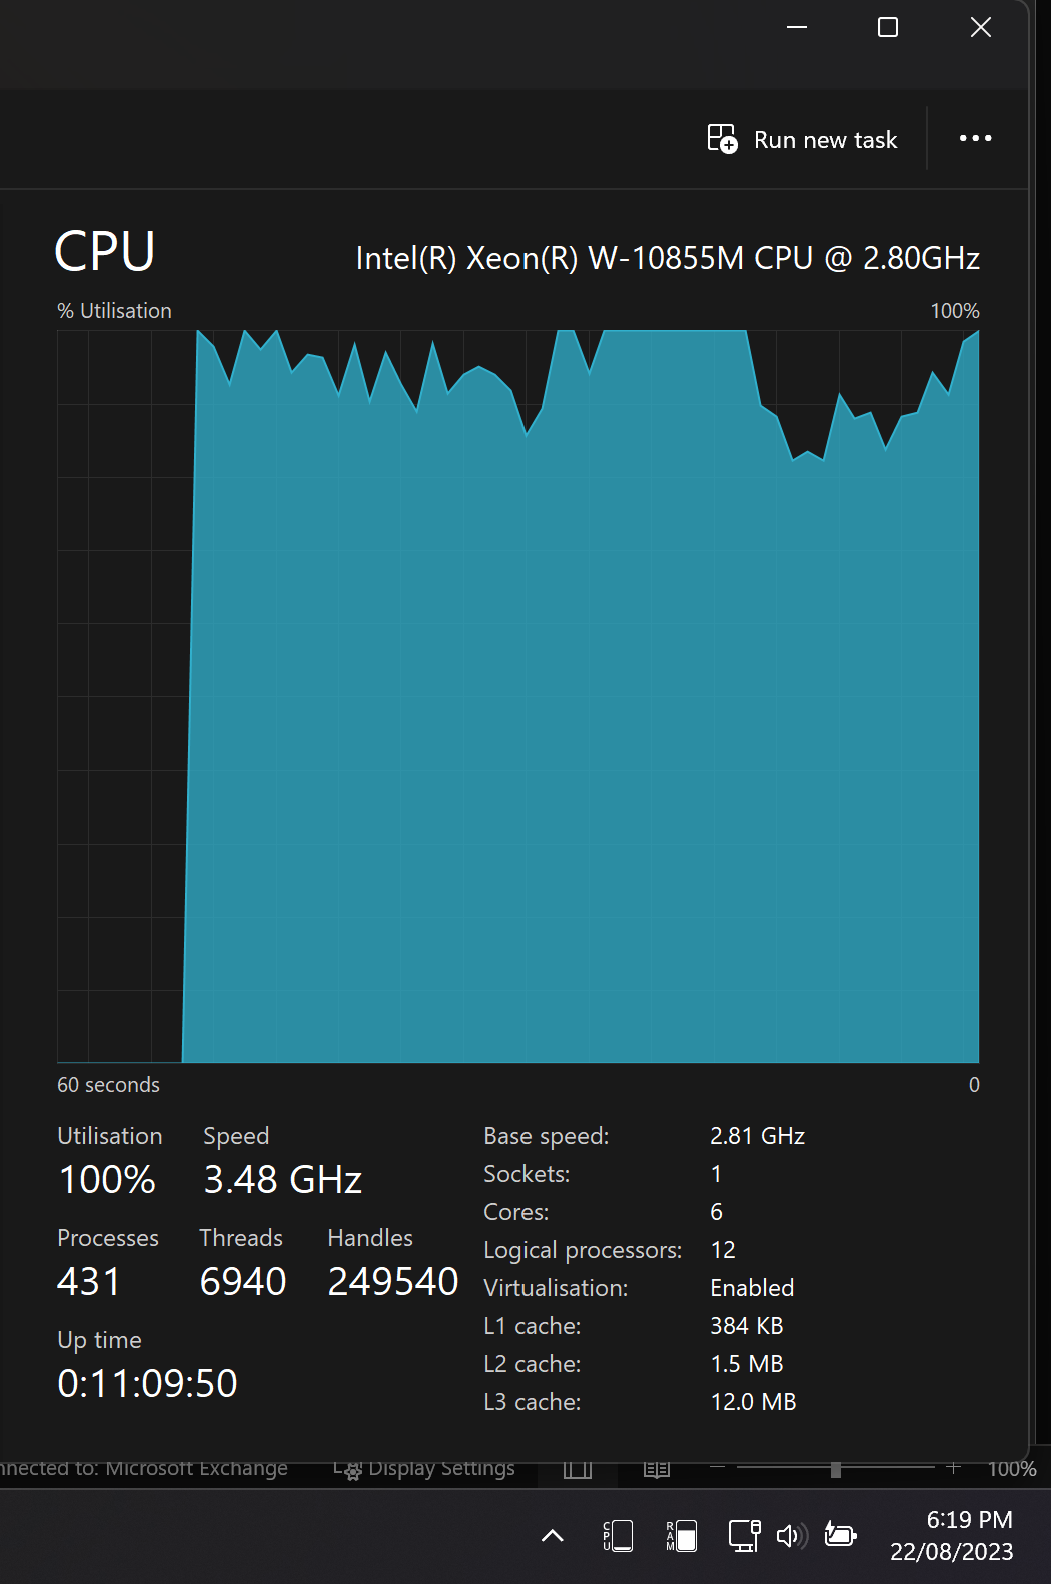
Here are some screenshots of a recent example, where the system was at 100% CPU usage due to several VMs running on the host which were internally performing intensive work. These map to the `vmware-vmx.exe` processes, but you can see TrayStatus shows the system is barely more than idle.
The system itself is running Windows 11 22H2 with TrayStatus 4.7.1. The CPU has 6 cores (12 threads).
EDIT: You can see the TrayStatus CPU usage indicator in the bottom right of the "Wrong CPU Usage" screenshot.

VM Usage.png

Wrong CPU Usage.png
Aug 29, 2023 (modified Aug 29, 2023)
•
#1

ral1sh
56 discussion posts
Thanks Owen. Can you advise which performance counter(s) are being used by TrayStatus to show the CPU usage?
I believe it's the "% Processor Time" counter

ral1sh
56 discussion posts
Thanks Owen, I just did some more detailed testing myself and you're correct. It's using "% Processor Time", and this is the "optimal" counter for it to use. Task Manager's results can just be very misleading, hence my confusion. Nothing needs to be changed and thanks for the input.
Aug 31, 2023 (modified Aug 31, 2023)
•
#5